Running Pandeia
Before running
Observation duration
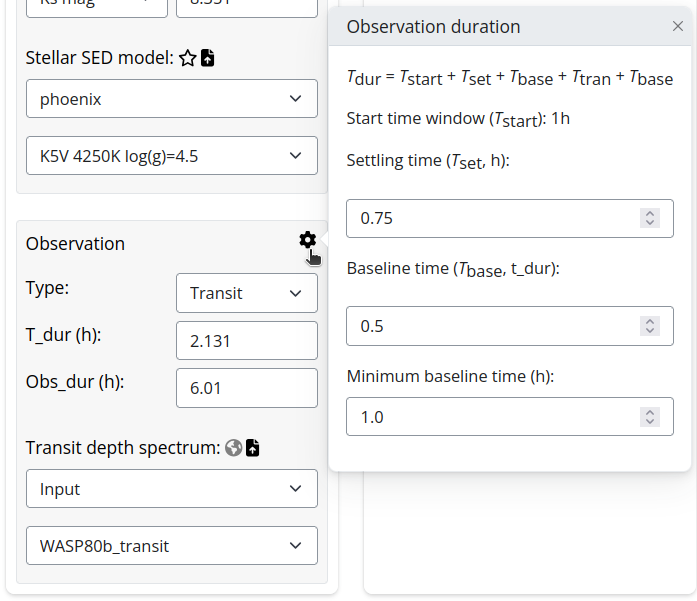
You may want to adjust the observation time in the Observation sub-panel in the lower left. The observation duration is automatically derived from the target’s transit duration according to the JWST recommendation for TSOs:
\[T_{\rm dur} = T_{\rm start} + T_{\rm settling} + T_{\rm baseline} + T_{\rm transit} + T_{\rm baseline}\]
Where each term is:
- \(T_{\rm start} = 1\) hour (the start timing window).
- \(T_{\rm settling} = 0.75\) hour (settling time for telescope systematics).
- \(T_{\rm transit}\) is the duration of the transit/eclipse
- \(T_{\rm baseline}\) is the baseline time before and after transit/eclipse
The baseline time is calculated as
\[ T_{\rm baseline} = \max(0.5 T_{\rm tran}, 1{\rm h})\]
Surely, users can directly set the observing time or adjust the variables for this calculation by clicking the gear icon:
Exposure times
While you are setting the target and instrumental configuration the Results text display in the lower left shows you real-time exposure and saturation values (i.e., values are instantly updated as you change the configuration)
The exposure time shows you the length of the observation according to the instrument setting in seconds (e.g., to assess the length of a single integration):
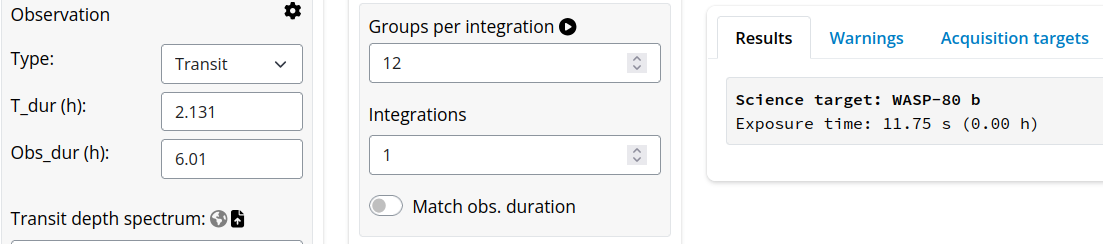
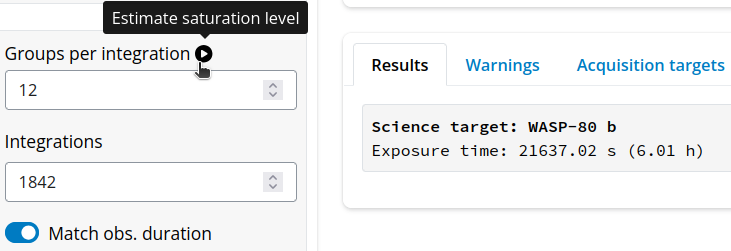
And also in hours, to make sure the total TSO observing time is correct. to simplify this step, click the Match obs. duration switch to automatically adjust the integrations to match the Obs_dur time:

Saturation
Gen TSO provides pre-calculated saturation times for all PHOENIX and Kurucz SEDs (when calibrated in the Ks band) for most spectroscopic modes. So, users will immediately know how many groups can be set before a given saturation threshold.
For other cases (e.g., when providing a custom SED), click the button next to Groups per Integration to calculate saturation level:
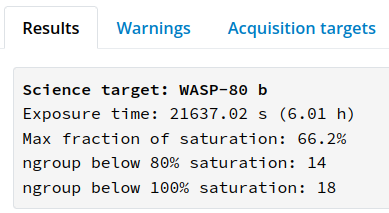
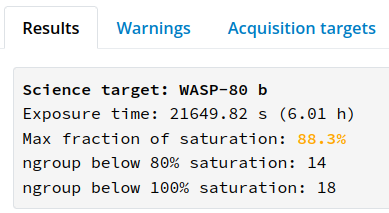
The Results panel will then show the max. fraction of saturation (updated in real-time for the current setting), and the number of groups that can be set before exceeding 80% and 100% of saturation at the brightest pixel:
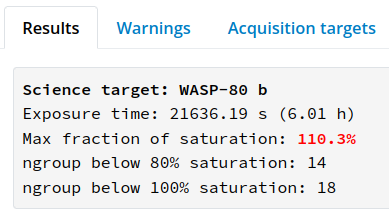
If you have dangerously high saturation levels, you will see the warnings in the Results panel:
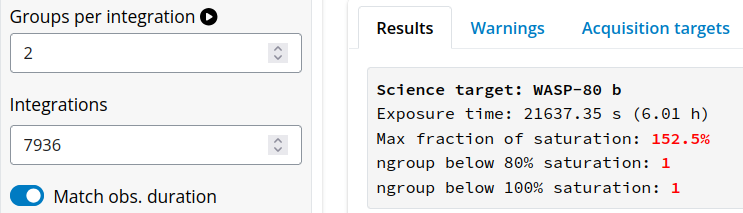
And if the observation cannot be carried out at all without saturating, the panel will show the warnings:
Running Pandeia
Once you are happy with the target and instrument configuration, just click the golden Run Pandeia button.
Different instrument and modes have widely different processing times in Pandeia; e.g., the NIRISS/SOSS and NIRCam/Short Wavelength modes will take some more seconds than other modes.
Figures
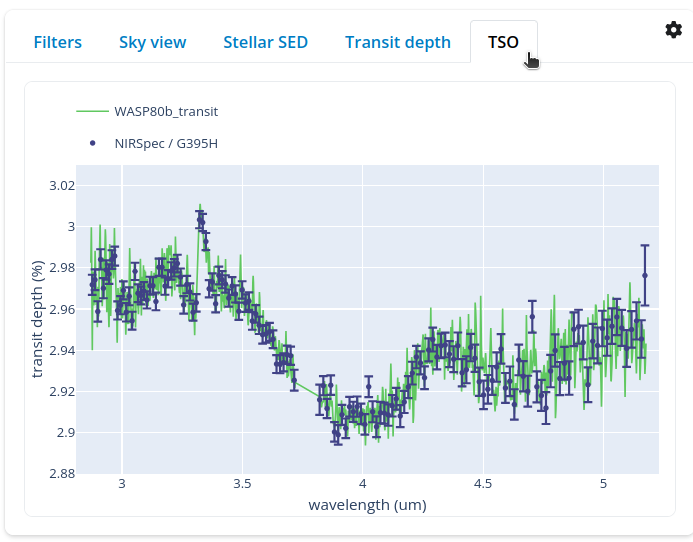
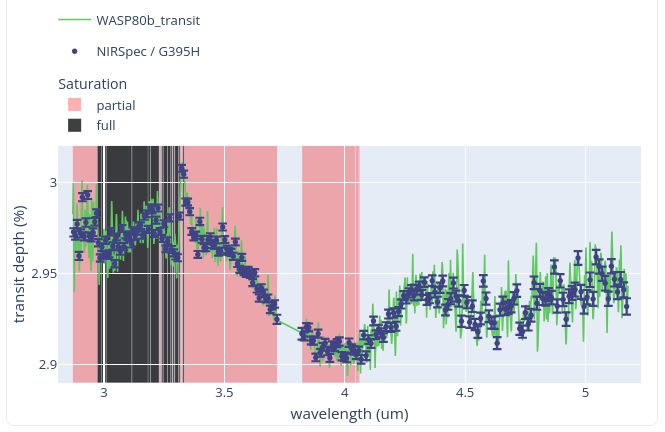
When finished, the TSO tab in the viewer panel will show the simulated transit or eclipse depth spectrum:
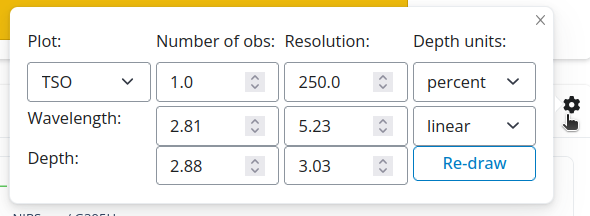
On this panel, click on the gear icon to open the plots menu where you can select plotting options that will update the plot in real-time:
- How many collected observations
- At which resolution sample the noised-up spectrum
- Wavelength and depth ranges and scales
- Draw a new realization of the noised-up spectrum
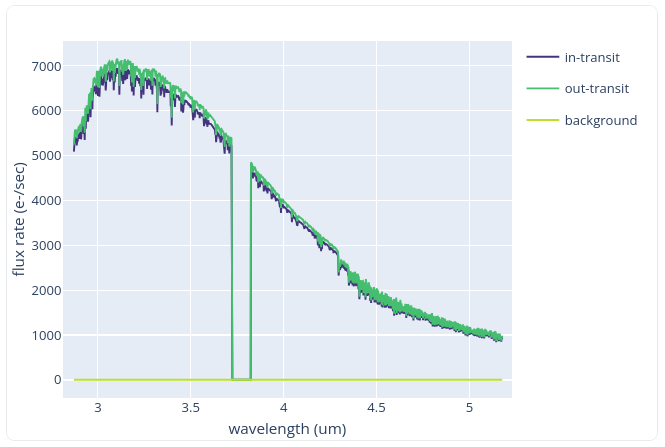
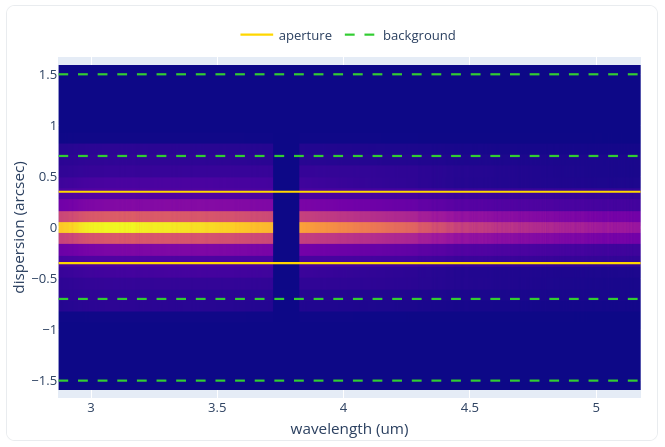
The first button in this menu also allows you to select and display additional plots:
- 1D flux rate spectra of the source (in and out of transit) an background
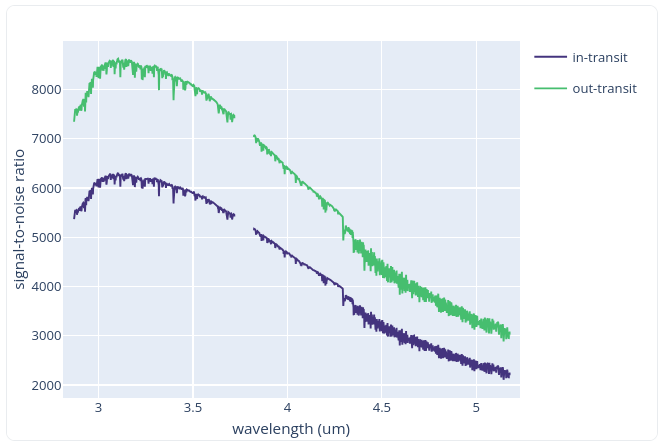
- 1D S/N of the flux spectra
- 2D flux rates on the detector
- 2D S/N at each pixel on the detector
- 2D detector saturation mask
- 2D detector map of number of group before saturation
Here are some examples:
In case of any partial of full saturation, the 1D plots will hightlight the affected wavelengths:
Text outputs
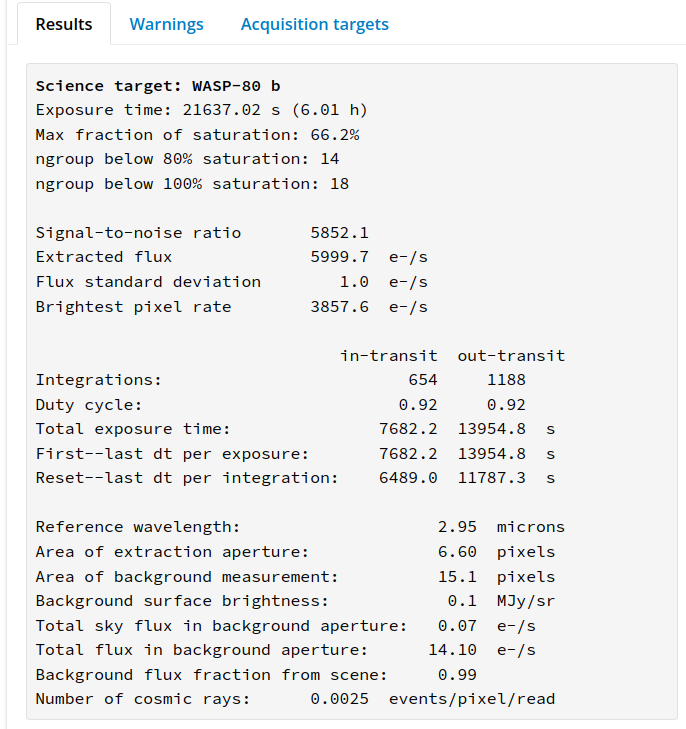
When a TSO run has finished, the Results panel at the bottom will display a summary of the run, similar to what you see in the ETC (with some values broken down by in- and out-of-transit):
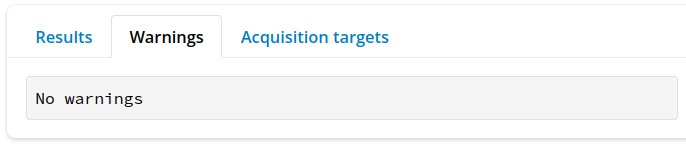
The Warnings tab will indicate whether Pandeia raised any warnings or not:
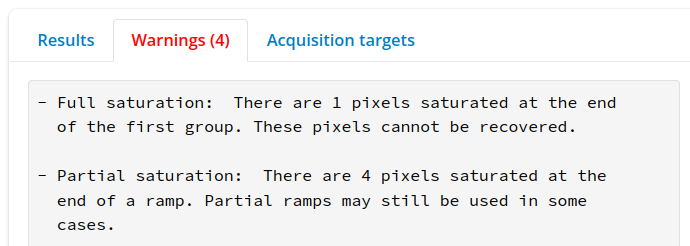
Collecting outputs
All Run Pandeia calls will be collected in the Display TSO run menu on the top right panel. These runs will be sorted by transit, eclipse, and aquisition run:
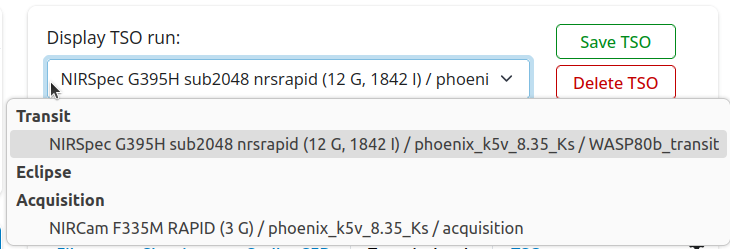
When selecting a run frmo this menu, the target and instrument configuration will be updated to that of the run. Also, the plots in the TSO tab and the results/warnings tabs below will be updated according to the selected run.
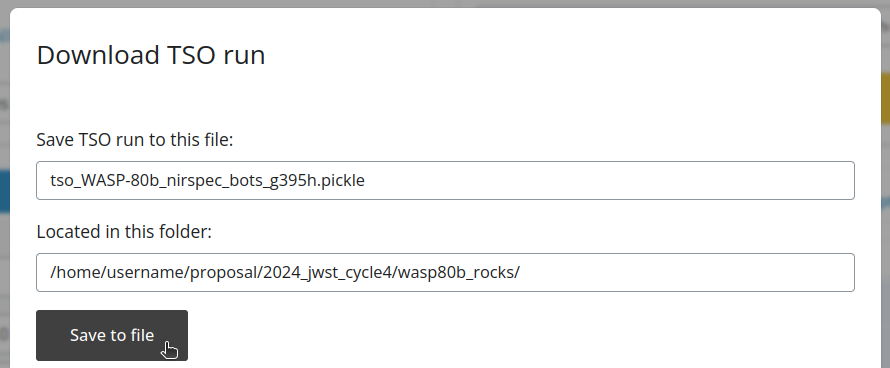
The buttons to the right of the menu allow users to delete runs or save them to Python pickle files for later use. Clicking on the Save TSO button will pop up the following panel where users can set the directory and file name for the pickle file: