Picking up a TSO run
Simulated transit/eclipse spectra
Say you ran and saved a TSO simulation for your favorite planet.
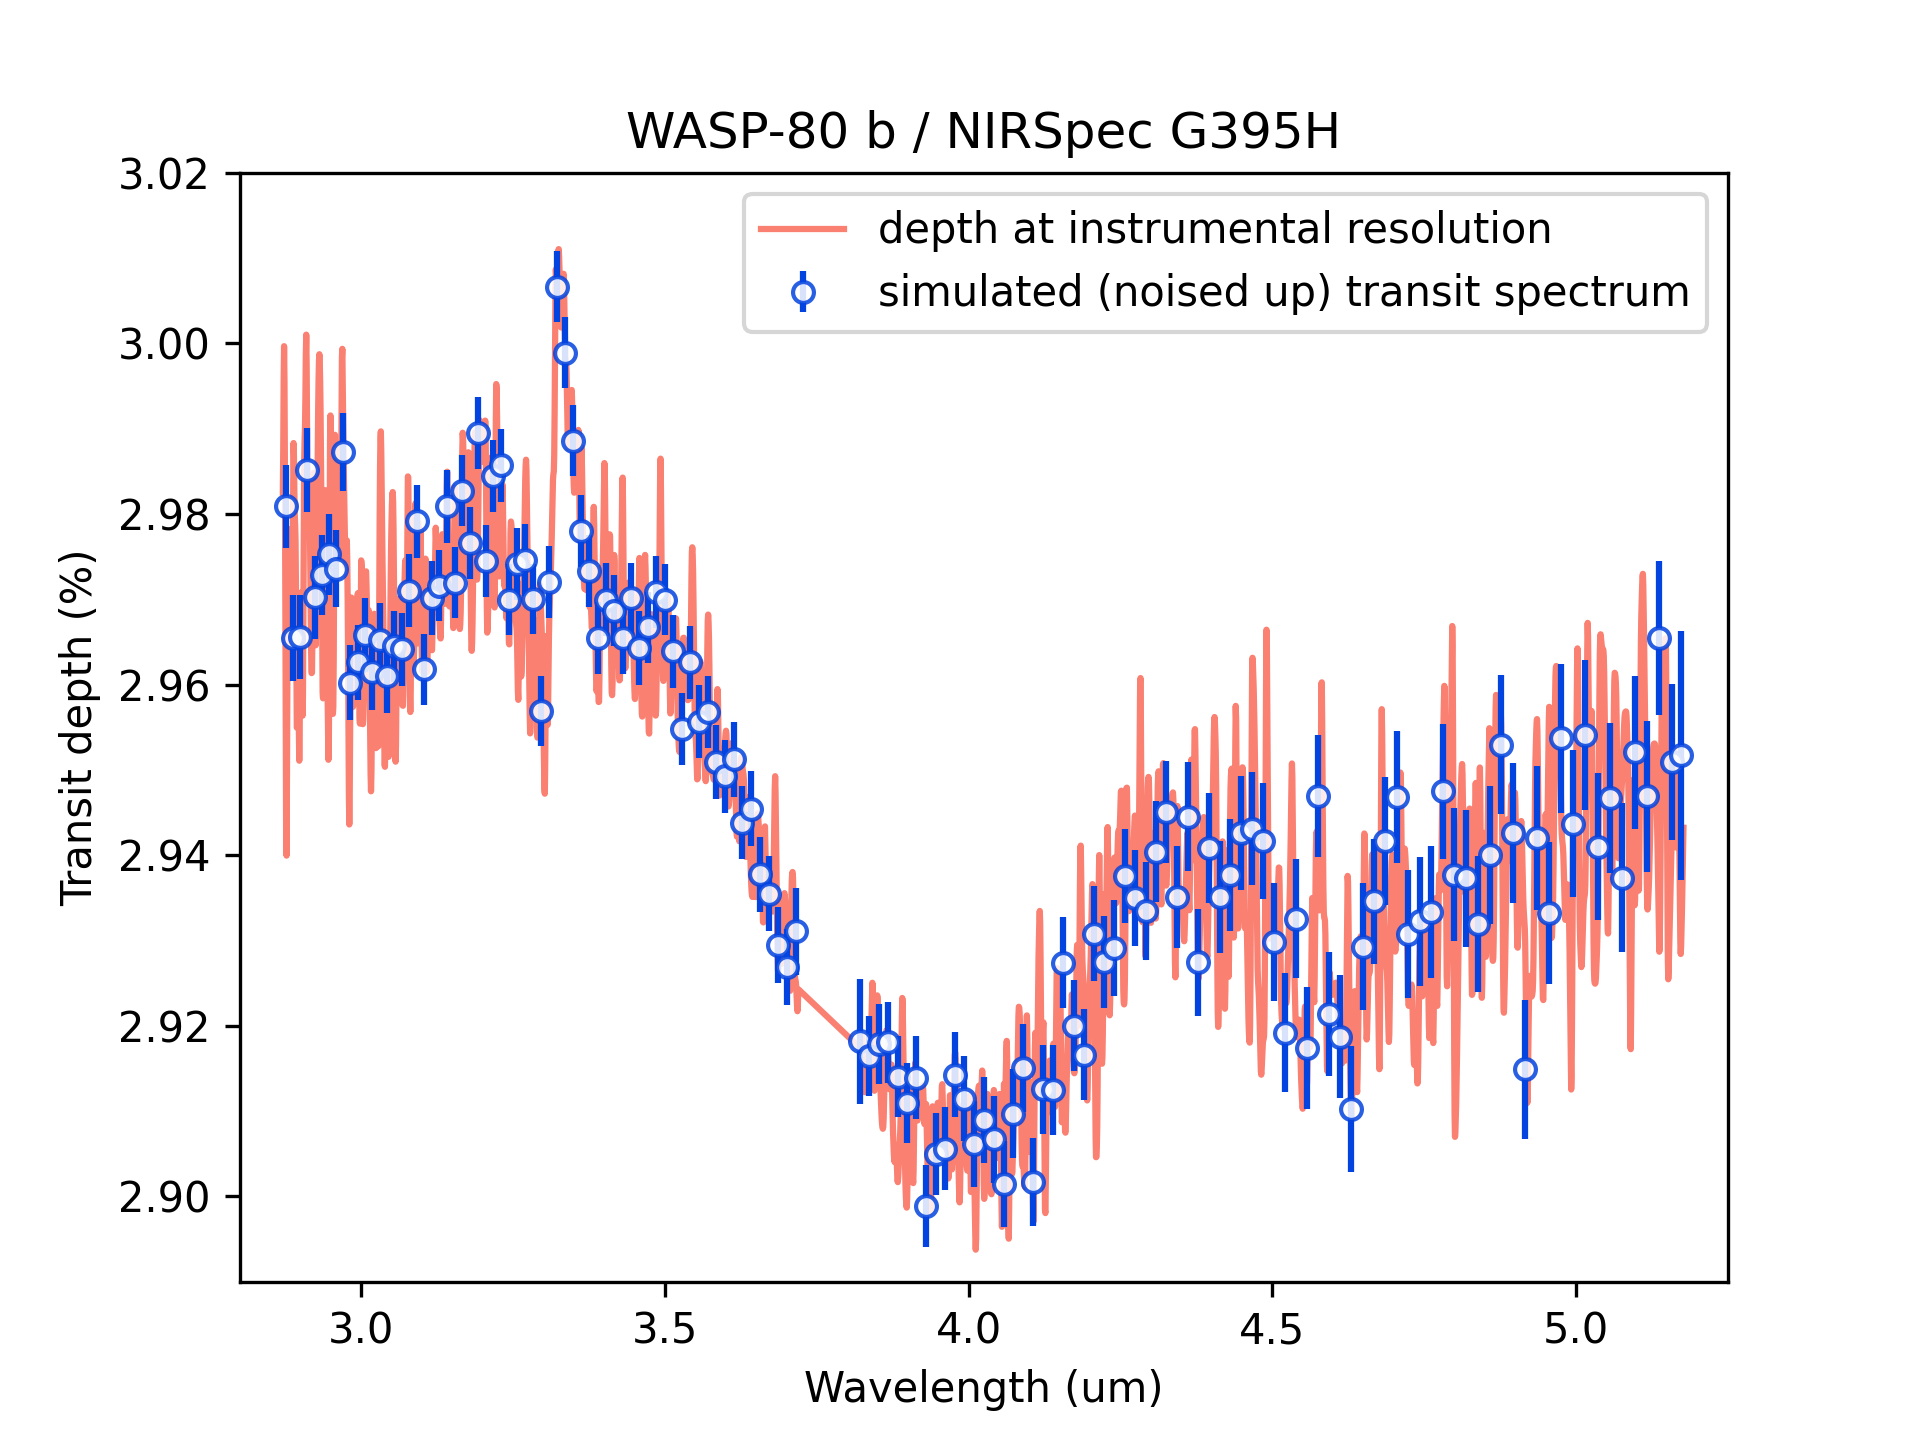
Lets pickup that pickle file and generate some simulated transit depth spectra:
import pickle
import gen_tso.pandeia_io as jwst

import matplotlib.pyplot as plt
import pyratbay.constants as pc
plt.ion()

with open('tso_transit_WASP-80b_nirspec_bots_g395h.pickle', 'rb') as f:
    tso = pickle.load(f)

# Draw a simulated transit spectrum at selected resolution
# - Set n_obs to simulate repeated observations to improve the S/N
# - Set noiseless=True to simulate spectra with no scatter noise
obs_wl, obs_depth, obs_error, band_widths = jwst.simulate_tso(
    tso, resolution=250.0, n_obs=1,
)


# Plot the results:
plt.figure(4)
plt.clf()
plt.plot(
tso['wl'], tso['depth_spectrum']/pc.percent,
    c='salmon', label='depth at instrumental resolution',
)
plt.errorbar(
    obs_wl, obs_depth/pc.percent, yerr=obs_error/pc.percent,
    fmt='o', ms=5, color='xkcd:blue', mfc=(1,1,1,0.85),
    label='simulated (noised up) transit spectrum',
)
plt.legend(loc='best')
plt.xlim(2.8, 5.25)
plt.ylim(2.89, 3.02)
plt.xlabel('Wavelength (um)')
plt.ylabel('Transit depth (%)')
plt.title('WASP-80 b / NIRSpec G395H')
The TSO pickle file content
# This is the content of the pickle file:
print(*list(tso), sep='\n')
wl
depth_spectrum
time_in
flux_in
var_in
time_out
flux_out
var_out
report_in
report_outThat is, the true-model spectrum (the user input model):
- wl: Wavelenght array (um) over the simulated detector at instrumental resolution
- depth_spectrum: Transit/eclipse depth spectrum at instrumental resolution
Timings:
- time_in: Time spent collecting flux (s) during transit/eclipse
- time_out: Time spent collecting flux (s) out of transit/eclipse
Flux rates and noise spectra:
- flux_in: Flux rate of source (e-/s) during transit/eclipse
- flux_out: Flux rate of source (e-/s) out of transit/eclipse
- var_in: Last-minus-first (LMF) variance of flux rate during transit/eclipse
- var_out: Last-minus-first (LMF) variance of flux rate out of transit/eclipse
Pandeia reports:
- report_in: Pandeia report during transit/eclipse
- report_out: Pandeia report out of transit/eclipse
Inside the Pandeia reports you can find all the important info, e.g., for the APT or ETC:
print(*list(tso['report_in']), sep='\n')sub_reports
input
1d
2d
3d
scalar
information
transform
warnings
web_reportThe input instrumental configuration:
tso['report_in']['input']['configuration']{'detector': {'nexp': 1,
'ngroup': 12,
'nint': 654,
'readout_pattern': 'nrsrapid',
'subarray': 'sub2048',
'max_total_groups': 7848},
'instrument': {'aperture': 's1600a1',
'disperser': 'g395h',
'filter': 'f290lp',
'instrument': 'nirspec',
'mode': 'bots'}}Output info and stats:
tso['report_in']['scalar']{'total_exposure_time': 7682.1979200000005,
'all_dithers_time': 7682.1979200000005,
'exposure_time': 7682.1979200000005,
'measurement_time': 6488.988,
'saturation_time': 10.824,
'total_integrations': 654,
'duty_cycle': 0.921467537509109,
'cr_ramp_rate': 0.0025249442969293733,
'extraction_area': 6.60377358490566,
'background_area': 15.09433962264151,
'fraction_saturation': 0.6423806,
'sat_ngroups': 18,
'brightest_pixel': 3857.607,
'filter': 'f290lp',
'disperser': 'g395h',
'x_offset': 0,
'y_offset': 0,
'aperture_size': 0.7,
'sn': 5852.06580539357,
'extracted_flux': 5999.726482570287,
'extracted_noise': 1.0252322311619642,
'background_total': 14.10125780745106,
'background_sky': 0.07178441201334484,
'contamination': 0.9949093610659743,
'reference_wavelength': 2.9502564180027684,
'background': 0.14797295413227118}